NICT's OptiMer searches continual-pretraining mixtures by merging distribution vectors
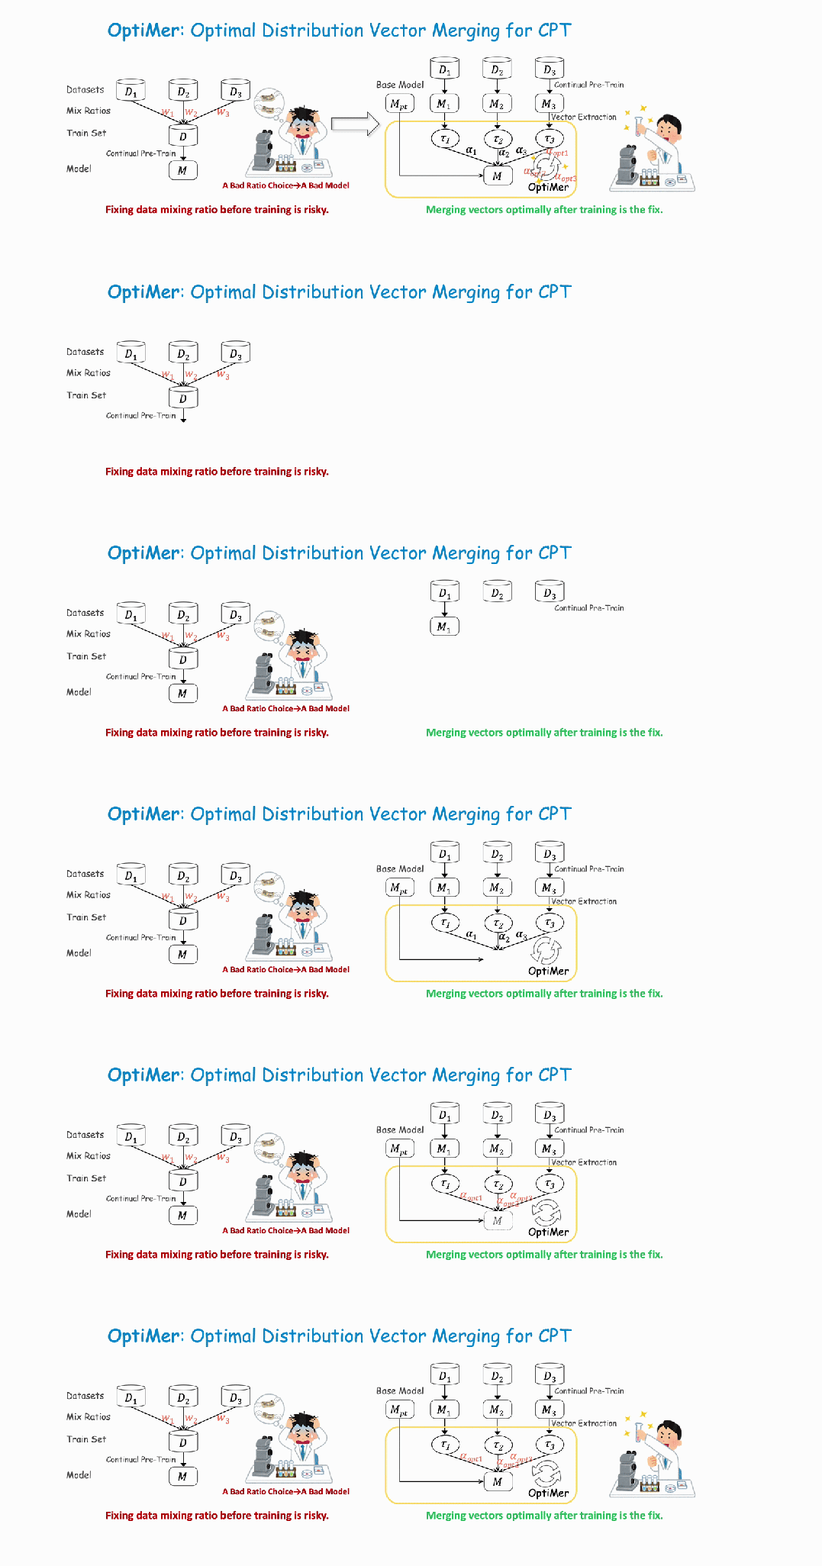
OptiMer first trains separate domain models, then adjusts vector-merging weights to avoid repeated training. Experiments report faster mixture optimization, while the initial domain-training cost remains.
How much should a model train on each type of data? Every model trainer faces this question.
Getting a training mixture wrong often means starting over. How much of each dataset to include in the training set has to be decided before training begins. Whether those proportions are good, however, can only be known after training has finished and the model has been evaluated. Poor results may require adjusting ratios and retraining, making experimentation expensive.
Haiyue Song and colleagues at Japan's National Institute of Information and Communications Technology (NICT) address this in OptiMer: Optimal Distribution Vector Merging Is Better than Data Mixing for Continual Pre-Training, proposing distribution-vector merging so mixture experiments need not retrain models from scratch.
The paper received an EMNLP 2026 Outstanding Paper Award, one of 22 recipients among 17,661 submissions.
- Paper: OptiMer: Optimal Distribution Vector Merging Is Better than Data Mixing for Continual Pre-Training
- Authors: Haiyue Song, Huy Hien Vu, Masao Utiyama
- Website: https://shyyhs.github.io/optimer

Method | From merging datasets to merging distribution vectors
We propose optimal merging: OptiMer.
Step one: train separate models on each data category. Starting from the base model, we perform continual pretraining separately on each dataset. For example, we train one model on Japanese data, one on Chinese data and one on mathematics data, obtaining three models.
Step two: extract distribution vectors recording training-induced changes. Subtracting the base model's parameters from the parameters of each trained model gives the corresponding distribution vector. It represents the changes that occurred in the model after training on that dataset.
Step three: automatically search for optimal merging proportions. Adding several distribution vectors in different proportions, along with an instruction-following vector, to the base model's weights produces a new model. Based on its performance on the validation set, we can continually optimize the proportions of the distribution vectors to achieve the best merge. Each attempt involves only model merging and evaluation, with no further training required.
Efficiency | 15–35x faster
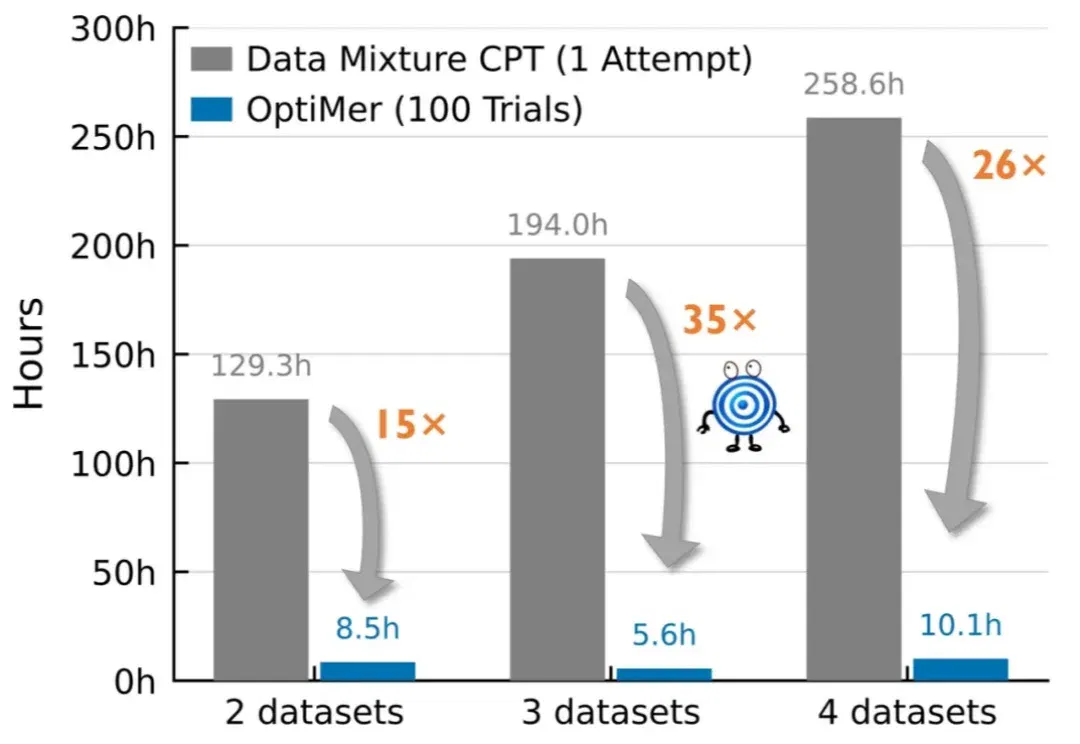
After initial training on each dataset, trying mixtures conventionally requires 129.3 hours to train just one ratio. OptiMer tries 100 ratios in 8.5 hours. In our experiments, mixture optimization achieved a 15–35x speedup.
Performance | Better than mixed-data training
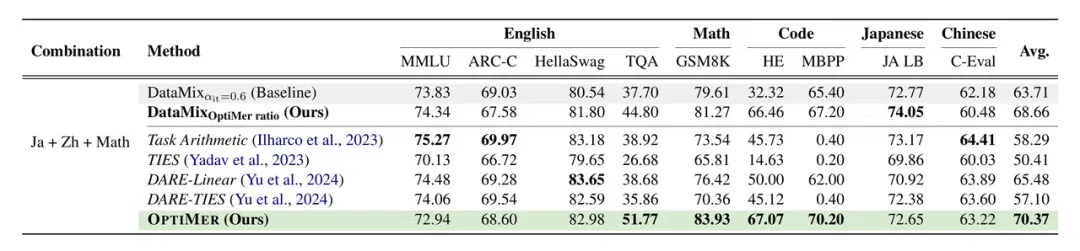
Across common benchmarks including C-Eval, Japanese Leaderboard, MMLU, GSM8K and HumanEval, OptiMer averages 70.37 versus 63.71 for conventional mixing, an improvement of about 6.7 points.
We also found that the optimal merging weights identified by OptiMer can guide the data proportions used in a data-mixing scheme. When we used the merging weights directly as the data-mixing proportions and retrained the model, the average score rose from 63.71 with equal-proportion mixing to 68.66.
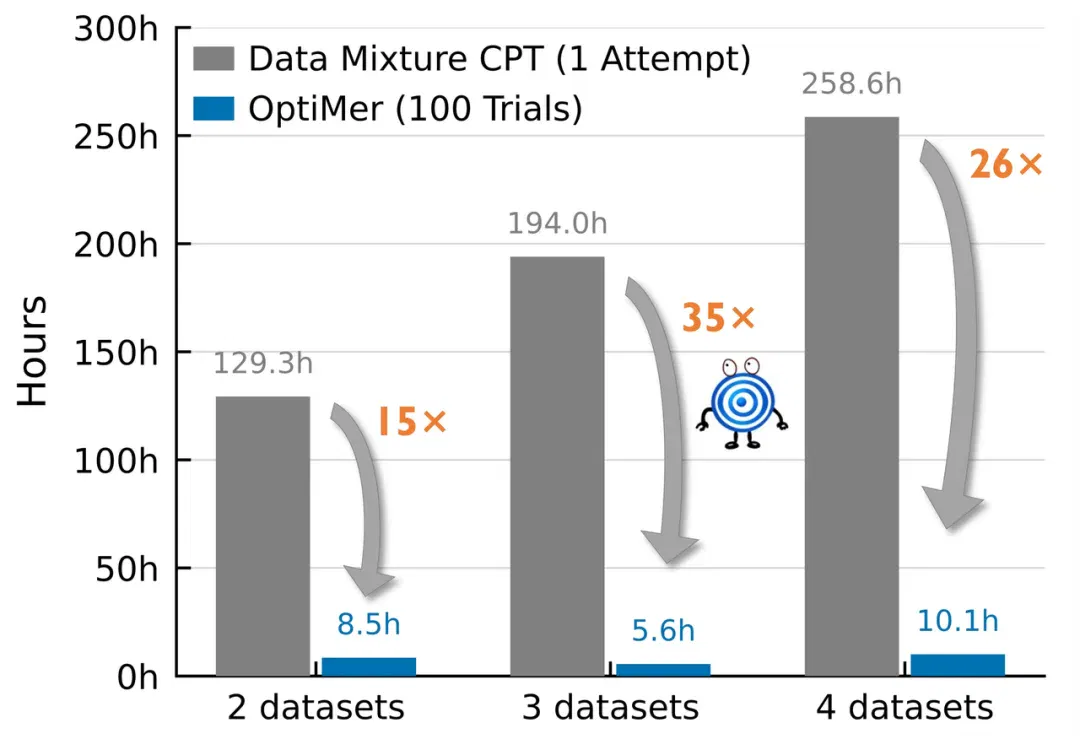
Flexibility | Rapid reoptimization for new tasks
For a new task, traditional data-mixing methods require adjusting the proportions and training again. This process is extremely costly, preventing traditional methods from adapting quickly to new tasks. Our method, however, can reuse distribution vectors that have already been trained; it only needs a different evaluation objective and an automatic adjustment of the merging weights. For example, optimizing for English tasks gives the highest score on the corresponding tasks; optimizing again for mathematics can produce good performance on mathematics tasks; and optimizing again for Japanese tasks can quickly produce a model specialized for Japanese.
This situation is quite common in industrial deployment. If a company wants to develop specialized models for different domains, such as education or finance, traditional methods require a great deal of trial and error with training-data proportions. Our method, by contrast, can automatically and quickly produce specialized models.

Analysis 1 | Why distribution vectors can be merged
Will capabilities learned from different data interfere with one another during merging? We calculated the cosine similarity between every pair of distribution vectors. We found that the cosine similarity between distribution vectors and the instruction-following vector was only about 0.03, close to perpendicular, while the cosine similarity between different distribution vectors was about 0.3. We hypothesize that existing merging algorithms, such as DARE, can combine different vectors with relatively little loss.
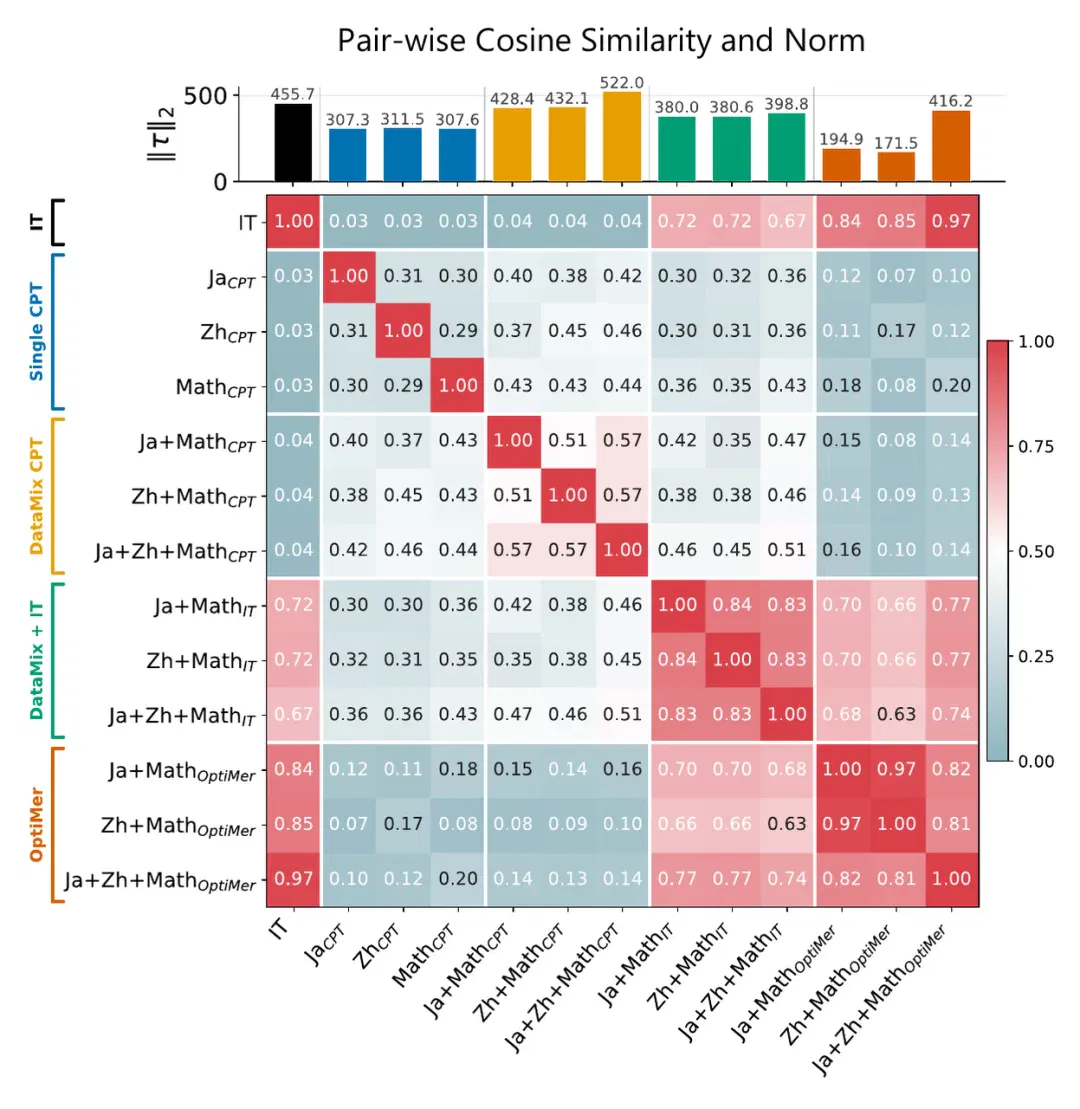
Analysis 2 | Principal component analysis
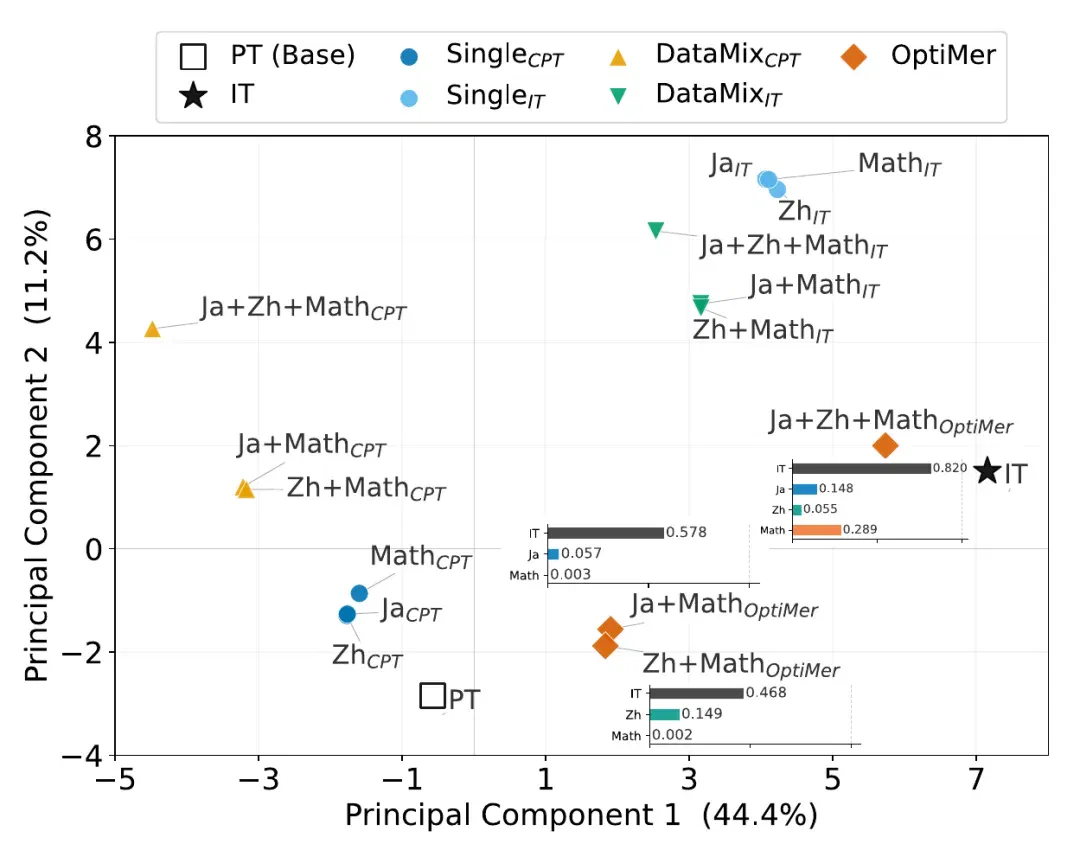
Using principal component analysis, we projected the high-dimensional distribution vectors onto a two-dimensional plane. Because each is the difference between the parameters of two models, its dimensionality equals the number of model parameters. First, the distribution vectors obtained through continual pretraining on different data lie far from the instruction-following vector. Then, from the bar chart of OptiMer's merging weights, we found that OptiMer tends to assign larger weights to the instruction-following vector and smaller weights to the data distribution vectors. As a result, the optimal model produced by OptiMer's merging actually lies near the line connecting the Base model and the IT model; we can imagine drawing a line from PT to IT. We hypothesize that good models should lie near this line.
Analysis 3 | OptiMer's search
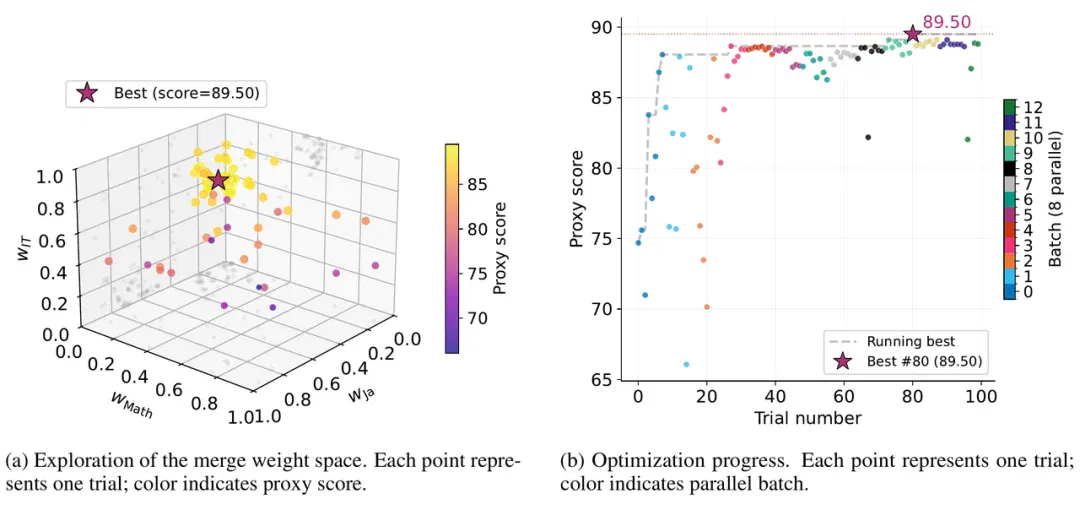
We examine how it finds optimal weights. The left chart shows weight space; the right shows score improvement through search.
The left-hand plot shows that high-scoring combinations are concentrated in a relatively narrow region, where the instruction-following vector has a larger weight and the data distribution vectors have smaller weights. This demonstrates the advantage of OptiMer's Bayesian optimization over grid search: grid search is prone to missing regions, especially when there are more datasets. OptiMer, however, needs only roughly 10*n searches, where n is the number of datasets.
The right-hand plot shows that, based on the data points already available, OptiMer's Bayesian optimization gradually concentrates subsequent searches in more promising regions. The algorithm we use supports parallel search, searching eight points at a time. It focuses on exploring the entire space in the early stage, converges rapidly in the middle stage, and finds the highest score of this search run in the late stage.
Analysis 4 | Vector changes during training
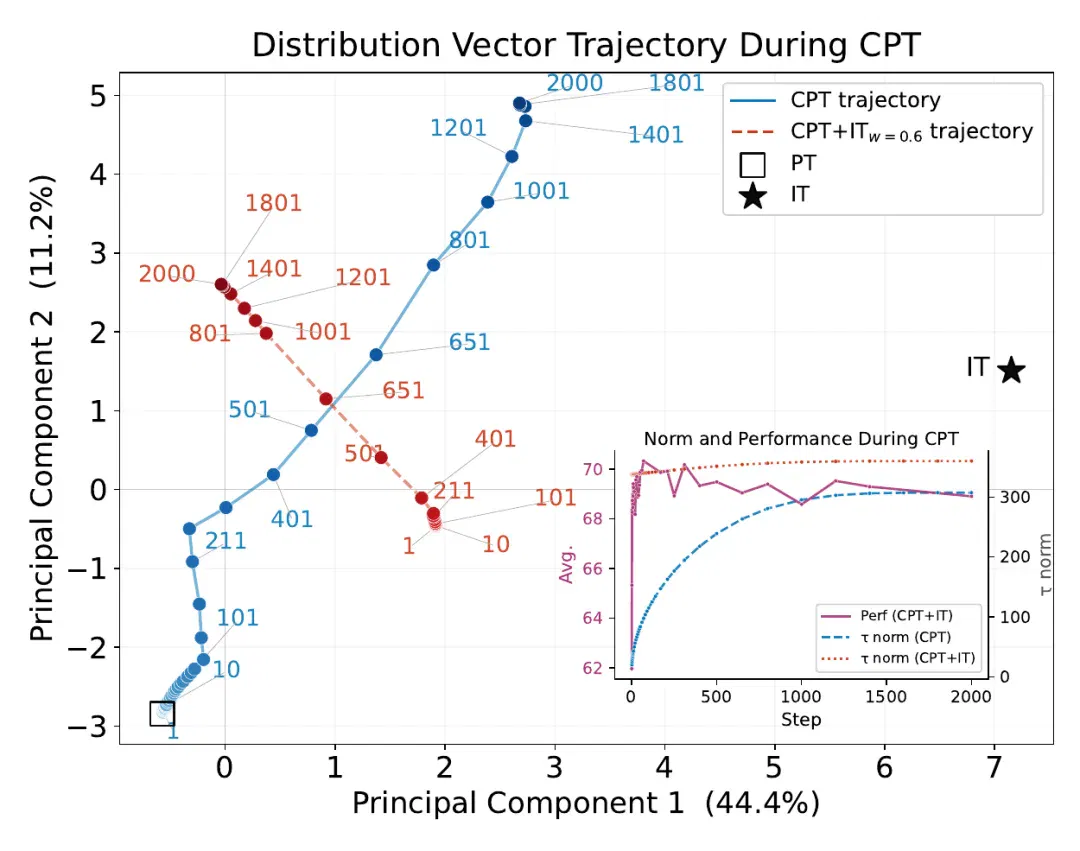
We recorded models at different training steps during continual pretraining to track how they changed. The main plot shows the trajectories of these vectors in the PCA plane, while the smaller plots show how vector length and model score change with the number of training steps.
The left-hand plot shows that the trajectory of continual pretraining is approximately a straight line. Increasing or decreasing the weight of a distribution vector is similar to increasing or decreasing the effective amount of training on that dataset.
The right-hand plot shows that, as training progresses, the norm of the distribution vector keeps growing, while model performance peaks early in training and then gradually declines. We hypothesize that this suggests the model should not move too far away from the base model. The same hypothesis also appeared in Analysis 2.
Analysis 5 | Negative weights
The weights of distribution vectors can be set to negative values. We found that this sometimes even produces better results. Does this mean OptiMer can perform machine unlearning, selectively forgetting certain knowledge in the data and thereby achieving better performance on the target task? This paper does not investigate the question further, but we consider it a very interesting one.
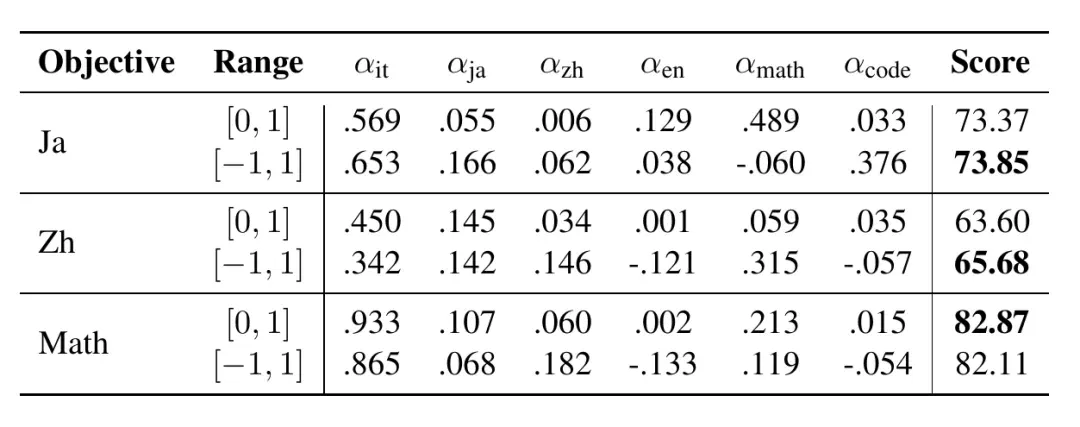
Application | A Japanese-specialized model
We apply OptiMer to AI Singapore's Gemma-SEA-LION-v4-27B, based on Gemma 3 and continually pretrained on Southeast Asian languages.
The goal is better Japanese while retaining Southeast Asian language capabilities.
We continually pretrain on Japanese, Chinese, English, mathematics and code separately, extract distribution vectors, merge them with SEA-LION's instruction-following vector and search weights for Japanese-task performance.
Japanese scores rise from 66.34 to 74.40 while Southeast Asian task performance is preserved.

Conclusion
OptiMer adapts open models to target languages or domains more efficiently, effectively and flexibly than conventional mixing.
At the same time, this work conducted experiments only on continual pretraining. In the future, we hope to extend this approach to post-training to solve the problem of finding optimal proportions for the large number of datasets involved in post-training.
First author
Haiyue Song is a post-training engineer in Preferred Networks' language-model development department in Japan, formerly at NICT in Kyoto. He earned a Kyoto University informatics doctorate in 2024 under Professor Sadao Kurohashi and studied computer science and Japanese at Shanghai Jiao Tong University as an undergraduate. His research covers language models and machine translation.
This work was completed while the first author was at NICT.
This article comes from Synced. Author: Haiyue Song.
After reading
Join the AINRK community
Read how to join the community and connect with people working in AI.
Related articles
Continue reading related topics and articles in this category.
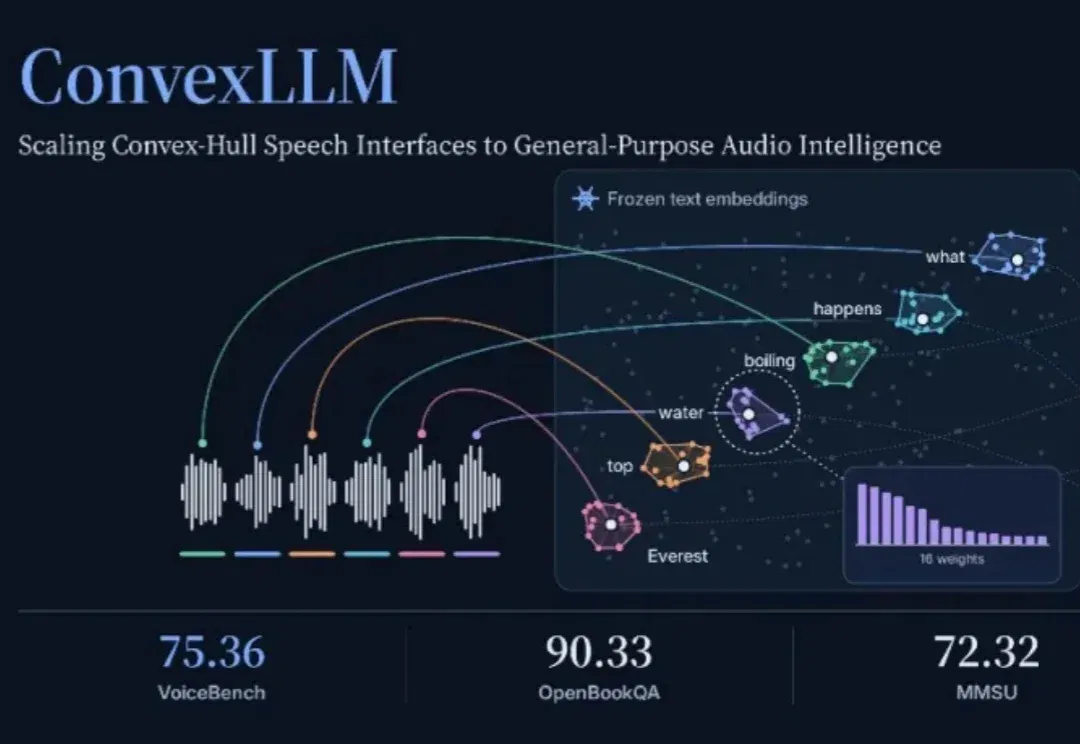
ConvexLLM connects speech to language models through frozen text embeddings (opens in a new tab)
Researchers at CUHK-Shenzhen and Microsoft propose C-Gate, mapping audio into convex combinations of frozen text embeddings. The paper reports VoiceBench gains against its listed open-model baselines, while audio understanding and transcription still involve trade-offs.
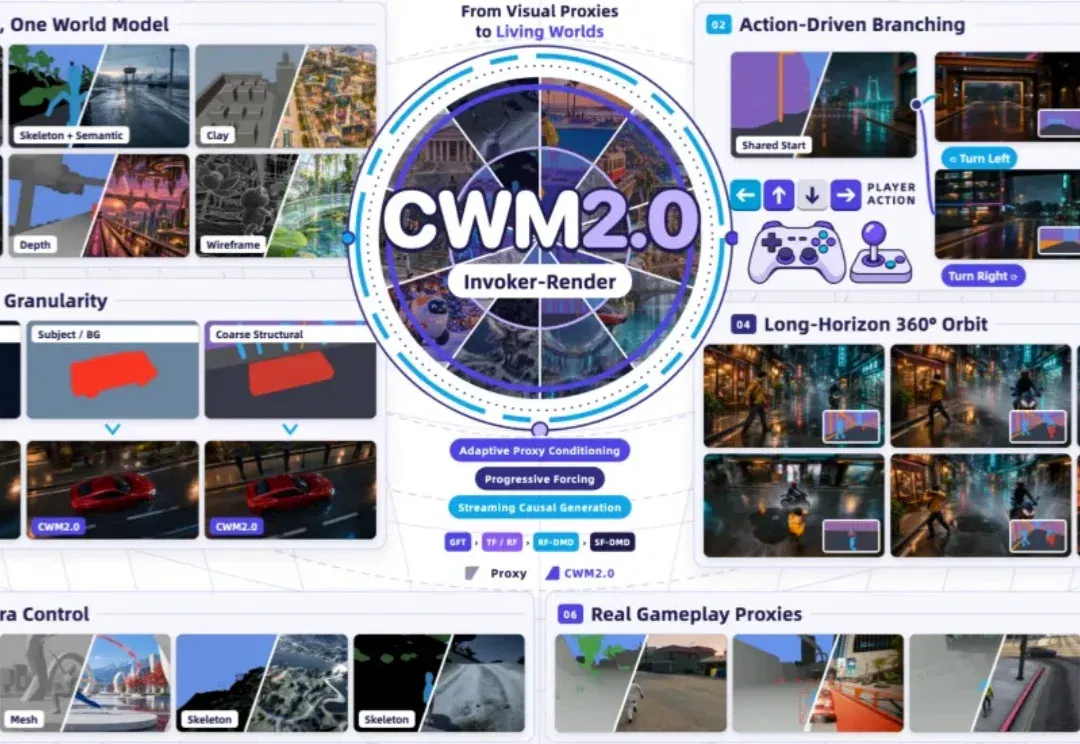
CWM2.0 open-sources generative rendering with a 30-minute racing demo (opens in a new tab)
Teams from Ant, Westlake University and Zhejiang University use a structured Proxy to control scene state and Invoker-Render to generate visuals, releasing eight-GPU streaming inference. The long demo and 140 evaluations cover specified scenes, not arbitrary stable worlds.

Ankole outlines multi-user agent architecture: events, permissions and organizational memory (opens in a new tab)
The team describes its Business Harness design for fast and slow paths, shared state, Actor orchestration and dynamic permissions. Formal verification covers the modeled core permission state machine; it does not replace security checks of the full deployment, external interfaces or implementation.

openJiuwen presents a Harnessless approach for reusing AgentOS execution tools (opens in a new tab)
openJiuwen uses app-development and swarm demos to show how built-in harness capabilities support sessions, tools and app management. Applications still define business rules and permissions; remote deployment and some capabilities remain planned or exploratory.
Ask-to-Distill optimizes training questions using teacher–student distribution signals (opens in a new tab)
UIUC and collaborators propose A2D, training a question generator with frozen teacher–student disagreement and compatibility signals before on-policy distillation. The paper reports gains in math, code and agent tasks; its learning-value proxy has limits.