HKUST assigns image IDs for tool reuse and evolves training questions with ODE

The visual-native harness lets tools reuse retrieved and cropped images; the team reports that ODE training raises an 8B model's eight-evaluation average accuracy from 24.9% to 39.0%.
Where was this photograph of snowy mountains taken?

The agent crops a section of ridgeline from the photograph and uses reverse image search to find the place name “Zheduo Mountain.” It then consults web pages and zooms in on another retrieved photograph to compare details, finally identifying the location as Zheduo Mountain Pass.
The difficulty lies in that final zoom. In many multimodal search systems, a model can see the photograph it has just retrieved, but when it wants to enlarge a detail, it cannot pass that image to the next tool.
To address this, MMSense Lab at the Hong Kong University of Science and Technology (HKUST) designed a Visual-Native Agent Harness. It assigns every image an ID so different tools can keep using the same image. Once the tools are connected, the model still needs to learn when to keep searching and when to return to an image.
The team therefore proposes On-policy Data Evolution (ODE), a data-synthesis method. A model receives a question, searches and calls tools until it gives an answer; this whole process is called a rollout. When generating questions for reinforcement learning, the model performing the rollouts is the target model that will subsequently be trained. From the perspective of recursive self-improvement (RSI), the method that generates questions for an agent is worth improving alongside the agent itself. ODE lets the data synthesizer adjust its question-generation rules based on the agent's problem-solving records, then uses the next round of rollouts to test whether those changes are appropriate. This work has been accepted at NeurIPS 2026.
Under the same harness, training with ODE data raises an 8B model's average accuracy across eight evaluations from 24.9% to 39.0%, and a 30B model's from 30.6% to 41.5%. In a separate comparison of question-generation methods, two 8B models undergo reinforcement learning on equal numbers of questions. The one whose question-generation rules are adjusted using rollouts outperforms the one using fixed rules on all eight evaluations.
- Paper title: Towards On-Policy Data Evolution for Visual-Native Multimodal Deep Search Agents
- Paper: https://arxiv.org/abs/2605.10832
- Project code: https://github.com/JoeYing1019/ODE
Letting search and image-inspection tools hand off to one another
In this work, we support nine tools that let agents retrieve web pages, papers and images, open source web pages, zoom or rotate images, and perform calculations with Python. Original images supplied with questions and new images returned by tools are stored in the same image bank. Each image has its own ID, which subsequent tools can use at any point during the current problem-solving process.
In the Zheduo Mountain example, the original photograph is <image:0>, and the cropped ridgeline is <image:1>. The agent passes <image:1> to the reverse-image-search tool, and a clear photograph returned by the search is saved separately as <image:3>. Even after consulting web pages in between, the model can still pass <image:3> accurately to the zoom tool when it wants to enlarge the new photograph.
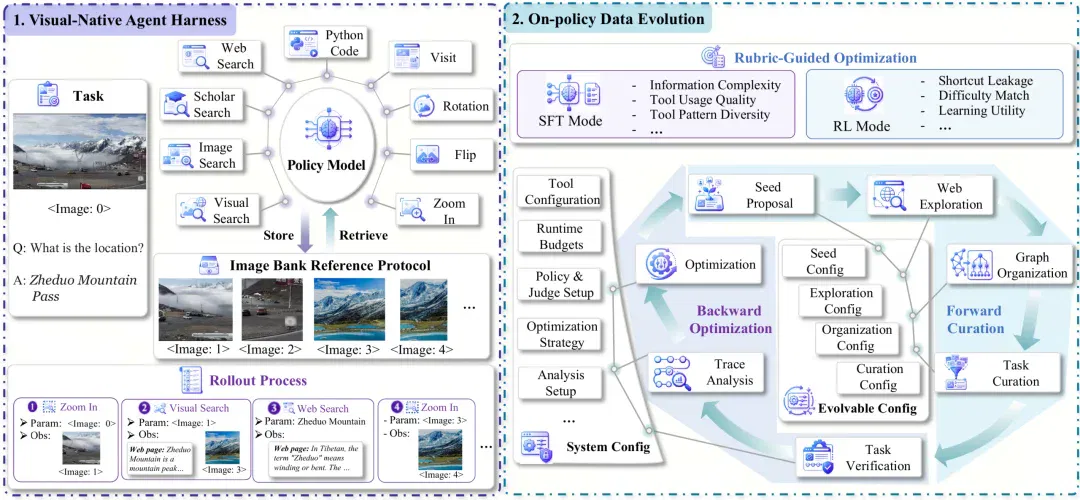
Figure 1: The left panel shows images passing between tools in the Zheduo Mountain example. The right shows ODE's process from collecting evidence and synthesizing questions to revising question-generation rules based on rollouts.
The harness also gives ODE the means to generate questions. The system first finds an entity that can be verified from at least two independent sources, then selects a related image. The image needs details worth identifying, such as a legend, numbers or markings. The system then follows web pages to collect clues, recording facts and sources for each one. Useful images are retained too, together with their IDs in the image bank.
The system organizes related clues into an evidence graph. Markings that need verification can be enlarged, and numbers on a web page can be cross-checked against another source. The question generator selects a connected set of clues from the graph and turns them into a question with a definite answer, then removes hints that would reveal the answer or the steps needed to solve it.
Once the questions are ready, it is the model's turn to solve them. In each round, ODE generates 32 questions using the current rules and lets the model complete a rollout for each. The parameters of the rollout model stay unchanged throughout these rounds. The model receives only the question and original image; reference answers are used for verification after it responds. An analyzer compares the full batch of problem-solving records with the evidence collected during question generation to diagnose what needs improvement. Approved changes are then written into the next round's question-generation rules.
How one map question changes the next round's generation rules
In one round of evolution to synthesize reinforcement-learning data, ODE began with United Nations map materials and found a world map from September 1948. It also found that the UN originally had 11 trust territories. Combining these two clues produced a question: what percentage of the original total were the trust territories marked on that map? The question concealed the total. To answer, the solver had to look up the denominator, read the legend and count the numerator.
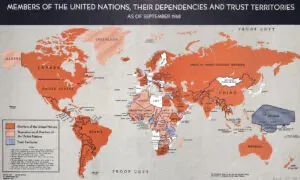
Figure 2: A world map from September 1948. Different shading indicates trust territories and other dependent territories.
The target model that would later undergo reinforcement learning completed this rollout. Given only the question and original image, it decided for itself which web pages to consult and which tools to use. It missed several trust territories and also counted South West Africa. Only after it answered did the system bring out the reference answer for verification: the map contained ten, or around 91% of the original 11.
The error was not just the final percentage. Comparing the rollout with the materials collected during question generation, the analyzer found a lack of item-by-item verification evidence for some small-print place names and legend entries. Drawing on the problem-solving records for the entire batch, ODE changed the rules: quantity-related clues had to be verified individually through reverse image search, and the maximum number of visual operations allowed while organizing evidence increased from four to five. At the same time, the target proportion of clues accompanied by images fell from 50% to 40%, leaving room to check clues one by one.
The new rules were applied in the next round to a chart of the navigation channels in Baltimore Harbor. The same model repeatedly zoomed and searched for images but still could not identify the dock. This batch of rollouts exposed another difficulty: too few image clues were available for comparison, making the questions too hard for the current model. ODE then restored the proportion of image-bearing clues from 40% to 50%. A change approved in one round could still be reversed in the next based on new problem-solving records.
This example also explains why two kinds of rollout need to be distinguished. When preparing training questions for reinforcement learning (RL), the solver is the target model that has completed supervised fine-tuning (SFT) and will next undergo RL. Whether it finds new clues or repeatedly searches without making progress directly affects whether a question is suitable for it. When preparing demonstrations for SFT, the teacher model GPT-5.2 instead performs the rollouts. Here, the focus is whether the problem-solving process is worth imitating: for example, which zoom helped verify the answer and which search was merely repetitive.
This adjustment of question-generation rules runs for at most five rounds. Each round examines whether the new rules can synthesize training samples suited to the current model. After evolution ends, the team selects the best-performing set of approved rules and uses it to synthesize the data needed for formal training in bulk.
The team selects 8,855 demonstrations for supervised fine-tuning from the teacher model's problem-solving records. Reinforcement-learning questions are prepared separately for each target model: 4,000 for the 8B model and 4,000 for the 30B-A3B model, used directly for their respective training after synthesis.
All three datasets cover 11 topics; they differ in question difficulty. According to the generator's difficulty labels, “hard” and “expert” questions together account for around 29% of SFT demonstrations, and around 62% and 94% of the RL questions for the 8B and 30B-A3B models, respectively (Figure 3). Switching to a stronger target model does not narrow the range of topics, but clearly increases the proportion of difficult questions in these exercises.
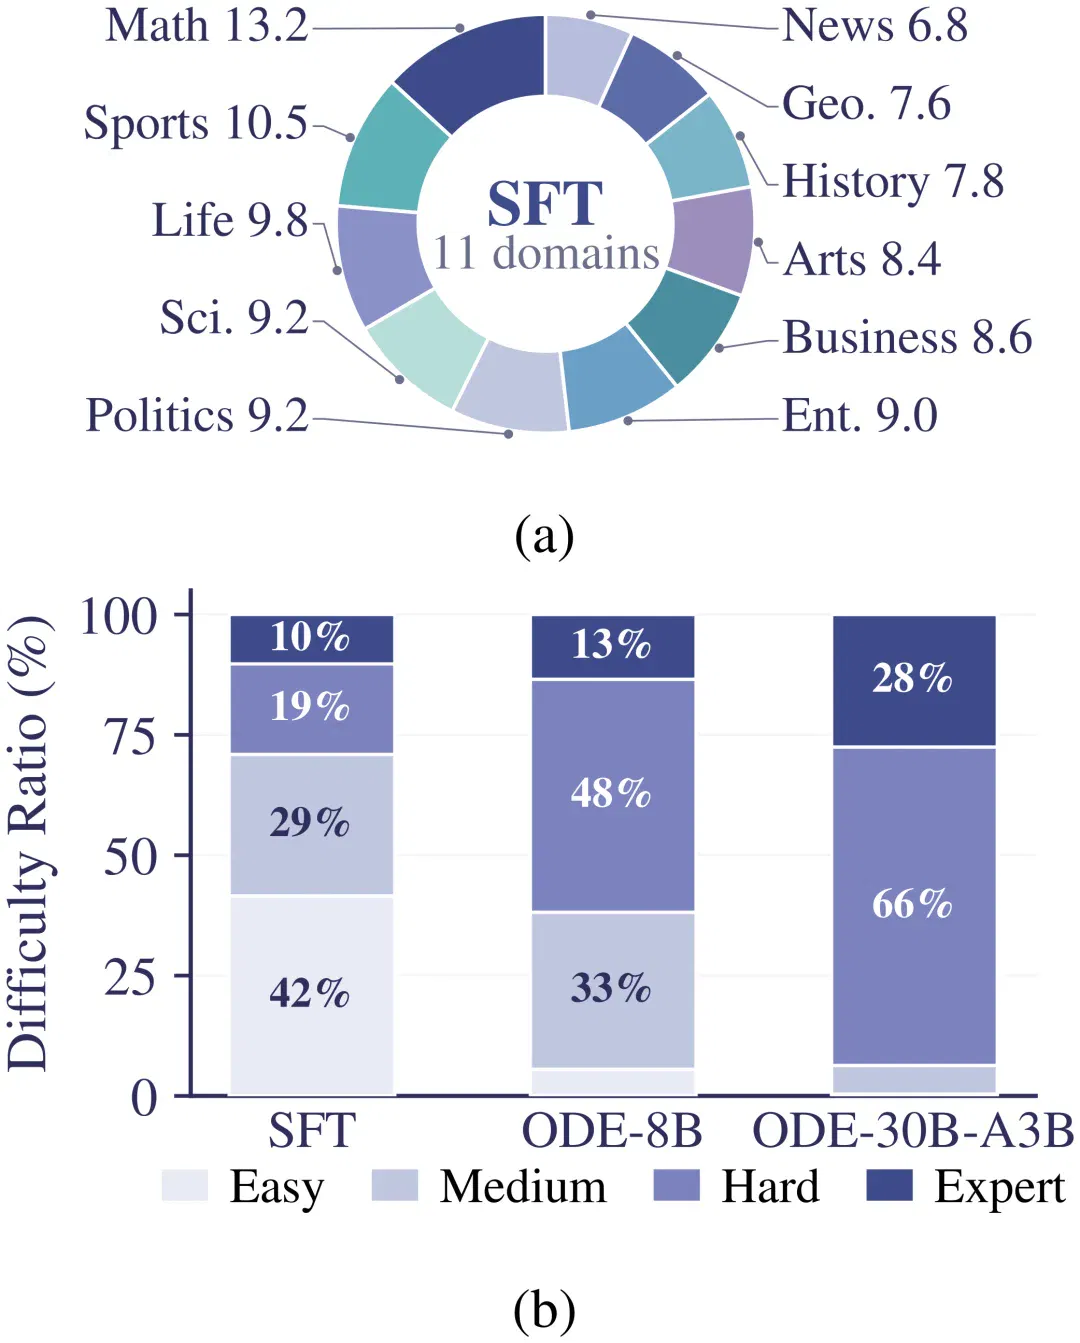
Figure 3: The top panel shows the topics covered by SFT demonstrations; the bottom compares the shares of different difficulty levels in the three training datasets.
From changing tools to training,
how results change across eight evaluations
The eight evaluations have different emphases. MM-BrowseComp (MMBC) requires models to find textual and visual clues across web pages, while SimpleVQA focuses more on factual question answering. Take Qwen3-VL-30B as an example. First consider the benefit of changing the harness: the same base model averages 24.8% accuracy across the eight evaluations with a standard search workflow, rising to 30.6% with the Visual-Native Agent Harness. Then consider the benefit of training: keeping the harness unchanged, supervised fine-tuning with ODE data raises accuracy to 39.5%, and further reinforcement learning takes it to 41.5%.
The 8B model shows the same trend on MMSearch, which requires actively retrieving external evidence. All three evaluations use the same tools. Accuracy for the base model, after supervised fine-tuning and after reinforcement learning is 47.3%, 61.7% and 66.0%, respectively.
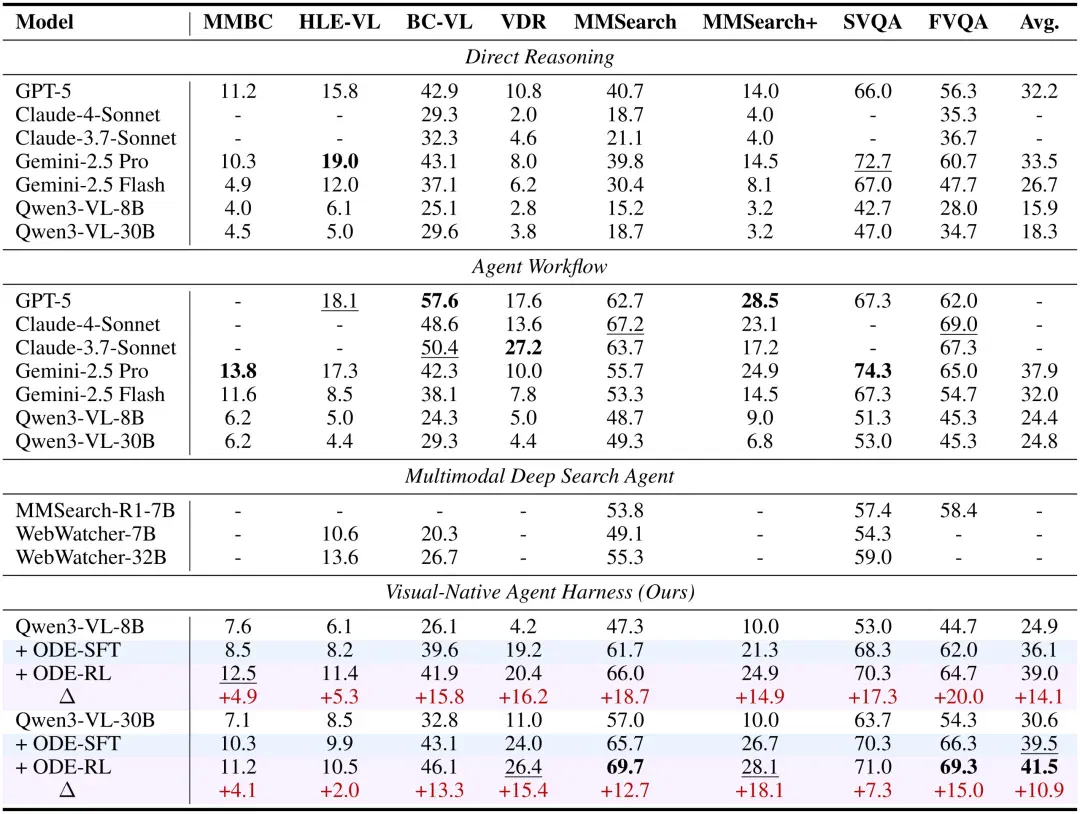
Table 1: Accuracy (%) on the eight evaluations. A dash indicates an unreported result; Δ is the improvement over the base model under the same harness, in percentage points.
The benefit of switching to this harness also appears in commercial models. Gemini 2.5 Flash's eight-evaluation average accuracy rises from 32.0% with the standard search workflow to 35.55%, and Gemini 2.5 Pro's from 37.9% to 42.21%. GPT-5 also improves on all seven evaluations for which scores are reported in both settings.
Even when commercial models can repeatedly use images retrieved during search, the trained 30B model remains competitive. Under the same harness, ODE-30B-A3B-RL averages 41.53% accuracy across the eight evaluations, 0.68 percentage points below Gemini 2.5 Pro's 42.21%. GPT-5's eight-evaluation average is 44.41%.
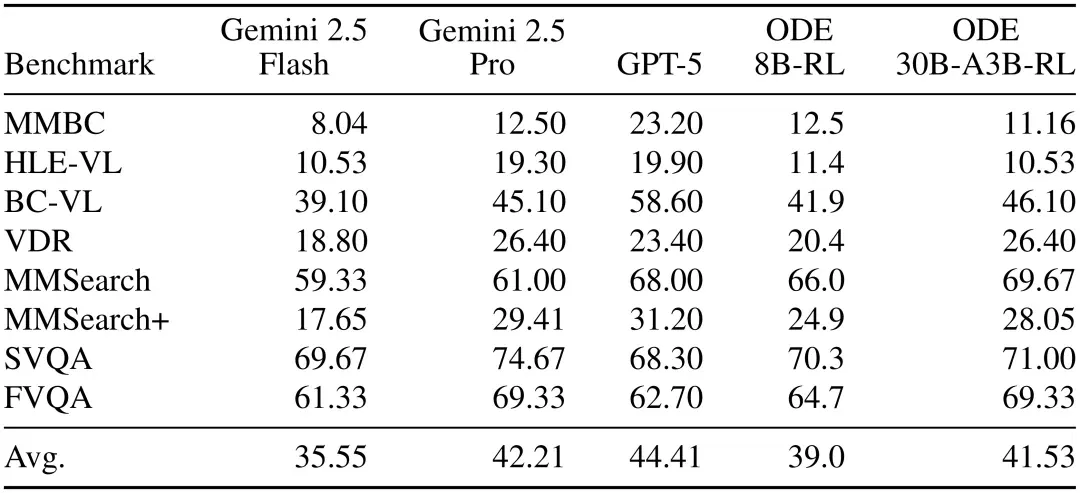
Table 2: Accuracy (%) on the eight evaluations when all models use the same Visual-Native Agent Harness.
The separate contributions of image reuse and data evolution
First, image reuse. On MMBC, around 40% of questions use images retrieved or cropped earlier, the highest reuse rate among the eight evaluations. The team runs a controlled comparison using the same ODE-8B-RL. In every setting, the model can see images returned by tools. The difference comes at the next step: how many earlier images remain available to pass as input to another tool?
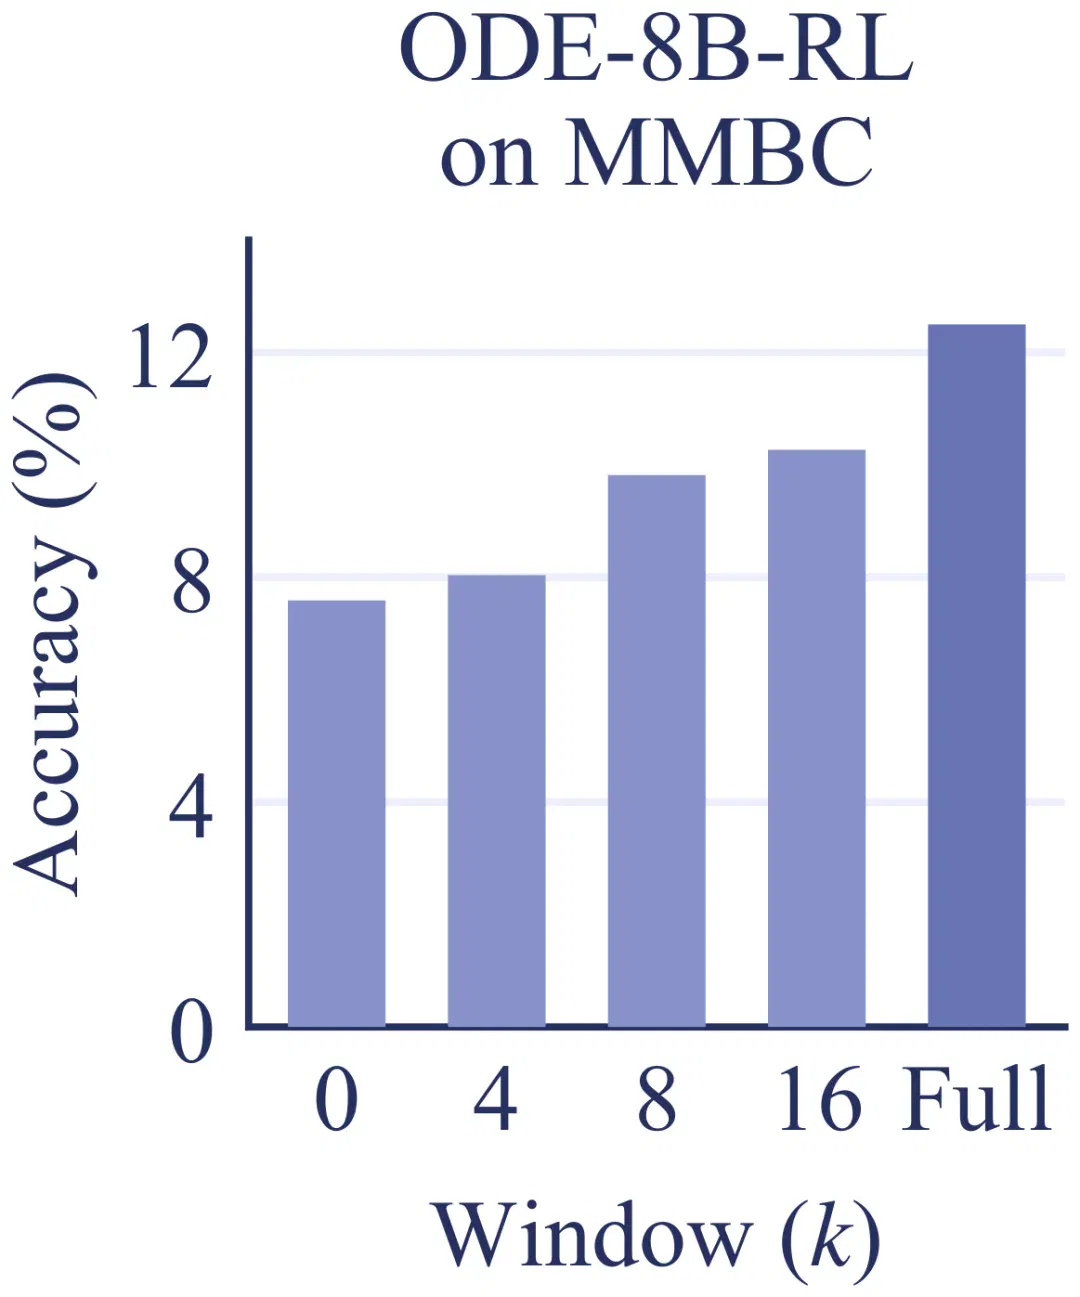
Figure 4: ODE-8B-RL accuracy on MMBC. The horizontal axis is the number of most recent images subsequent tools can retrieve. 0 means reuse is disabled; Full means all images are retained.
With reuse disabled, accuracy is 7.59%. As the retrieval limit is expanded to the most recent four, eight and sixteen images, accuracy rises. Retaining all images yields 12.50%. For MMBC questions that require repeatedly checking evidence, the latest few images cannot fully replace images found earlier.
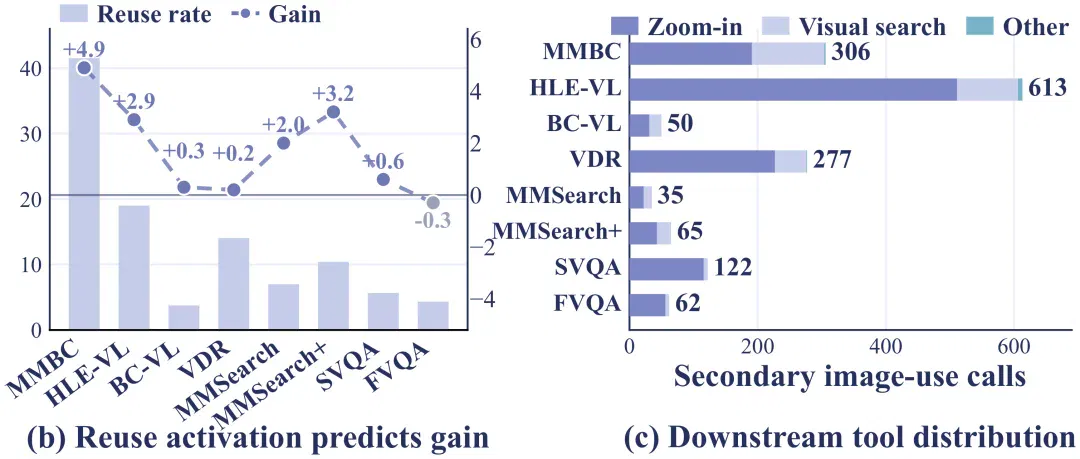
Figure 5: The left panel compares the proportion of questions involving image reuse across evaluations and the change in accuracy after reuse is enabled. The right counts reuse instances by tool type.
What does the model mainly do with reused images? MMBC records 306 instances of image reuse: 191 for zooming and 113 for reverse image search. The Zheduo Mountain example links these two behaviors: a cropped ridgeline can be used for search, and a retrieved photograph can then be enlarged for closer inspection.
To isolate data evolution's contribution, the number of training samples must also be held fixed. The team keeps the same material-collection, evidence-organization and question-generation workflow, changing only one thing: one group always uses the initial question-generation rules, while the other lets ODE revise the rules based on each batch of rollouts. The two groups prepare equal numbers of SFT demonstrations and RL training questions.
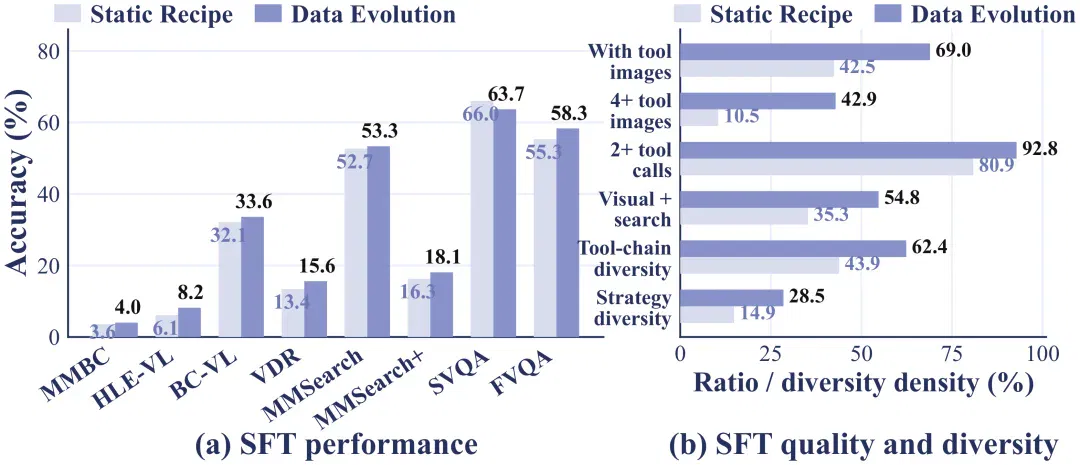
Figure 6: Both groups use 2,000 SFT demonstrations. The left panel compares the trained 8B models' results; the right compares image and tool usage in the demonstrations.
Each group has the same 2,000 SFT demonstrations, but their content differs. With the initial question-generation rules, only 10.5% of demonstrations contain at least four images returned by tools; the ODE group reaches 42.9%. Demonstrations combining image operations and search also rise from 35.3% to 54.8%. The student model therefore sees more problem-solving processes that combine searching and inspecting images. Training 8B models separately on the two sets of demonstrations, the ODE group leads on seven of the eight evaluations, with SimpleVQA the exception.
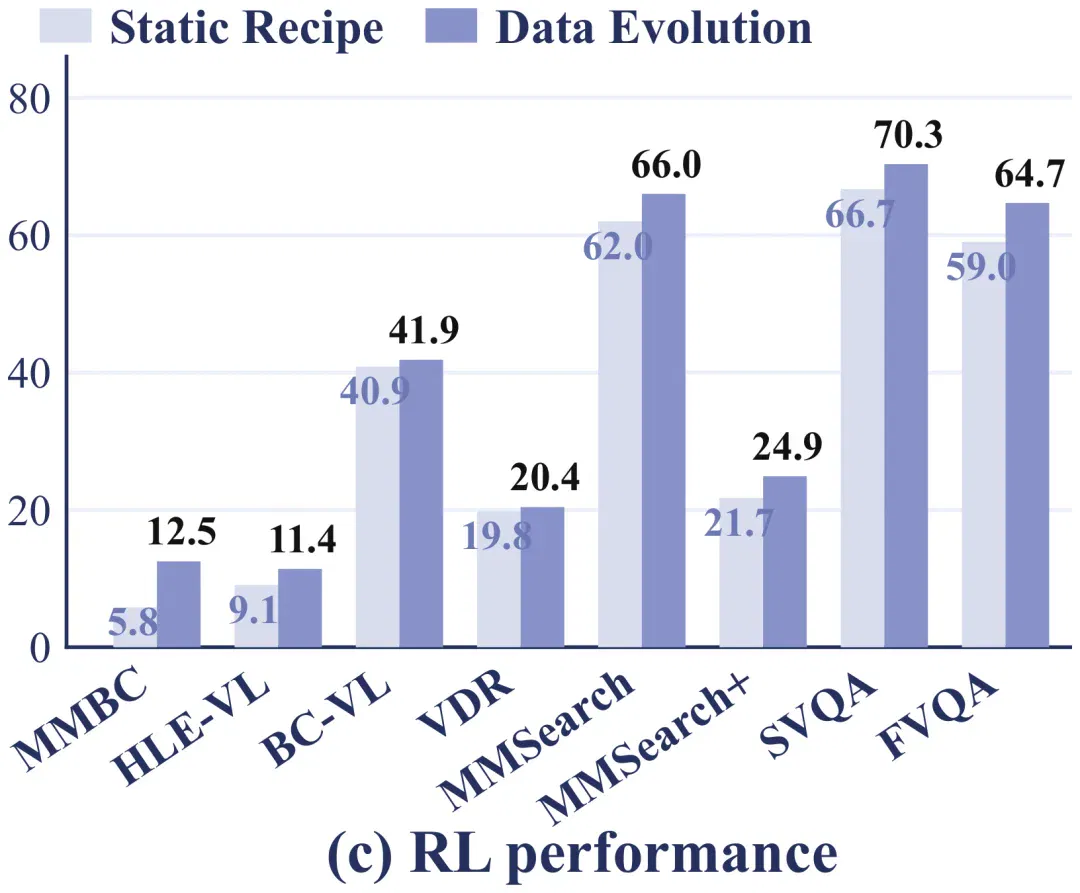
Figure 7: Both groups start from the same SFT-completed 8B model and use 4,000 questions each for reinforcement learning. The figure compares training results under the two sets of question-generation rules.
The reinforcement-learning comparison is more direct. Both groups start from the same 8B model after SFT and practice on 4,000 questions each. On MMBC, this model has 8.5% accuracy after SFT. Continued training on questions generated with fixed rules yields 5.8%. Using questions ODE generates for it instead yields 12.5%. The ODE group is also higher on all eight evaluations. Both groups use the same number of training questions; ODE's additional computation is spent on rollouts and analysis before training.
What exactly is better about the data ODE selects for the two kinds of training? By the fifth evolution round, the ratings of both SFT demonstrations and 8B RL questions are higher than in the first round (Figure 8). More revealing are the tool-call records left by the same teacher or target model on questions synthesized under the old and new rules (Figure 9).
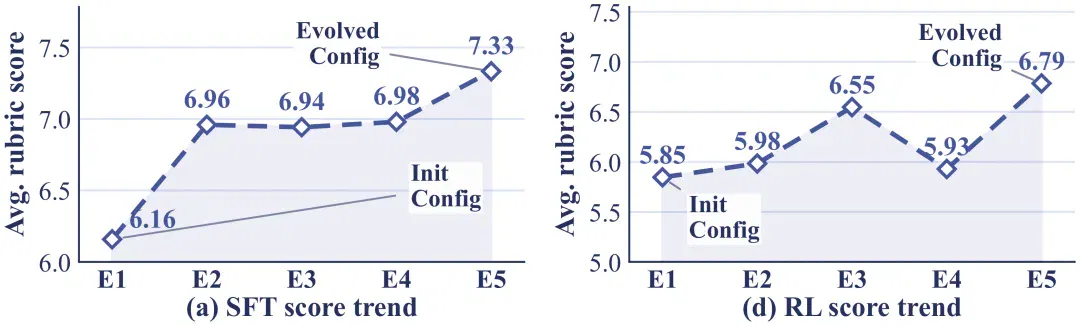
Figure 8: Average ratings of SFT demonstrations (left) and 8B RL questions (right) over five rounds of ODE data evolution. Every score plotted is the original rating plus 5.
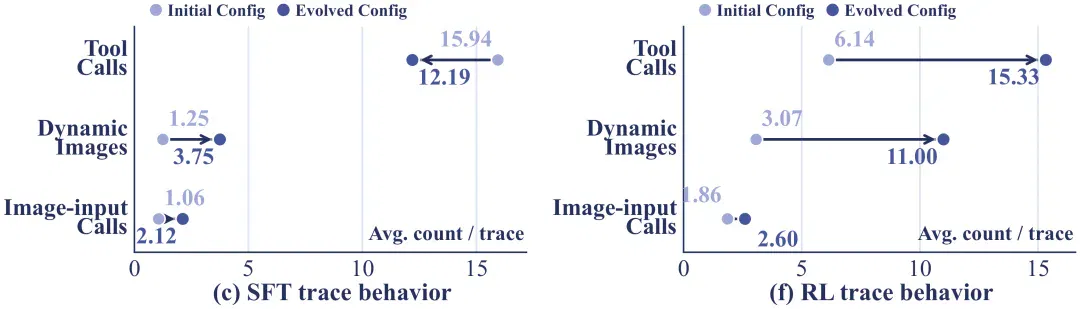
Figure 9: Questions generated under the initial and evolved rules are compared by tool calls per question, images returned by tools and calls taking images as input. Teacher demonstrations are on the left; rollouts by the 8B target model on RL questions are on the right.
In SFT demonstrations, the teacher's average tool calls per question fall from 15.94 to 12.19, yet images returned by tools increase from 1.25 to 3.75, and calls that pass an image back to a tool rise from 1.06 to 2.12. In other words, the teacher demonstrates more image-based verification in fewer steps. For the 8B target model solving RL questions, the direction is exactly the opposite: average tool calls per question rise from 6.14 to 15.33, and returned images from 3.07 to 11.00. After the rule changes, the same model needs a few more checks to advance the problem-solving process.
Returning to the 1948 map: an incorrect percentage is enough only to score the answer. Looking back through the rollout reveals which shaded areas the model failed to count and which markings it misidentified. Combined with diagnosis of the whole question batch, this gives ODE a basis for changing a specific step: in the next round, the question generator must verify quantity-related clues individually through reverse image search.
About the authors
First author Shijue Huang is a second-year PhD student at HKUST's MMSense Lab, researching multimodal agents and reinforcement learning. Corresponding author May Fung is an assistant professor in HKUST's Department of Computer Science and Engineering, researching multimodal knowledge reasoning and agents.
This article comes from the Synced WeChat account. Author: Synced.
Related topics
After reading
Join the AINRK community
Read how to join the community and connect with people working in AI.
Related articles
Continue reading related topics and articles in this category.
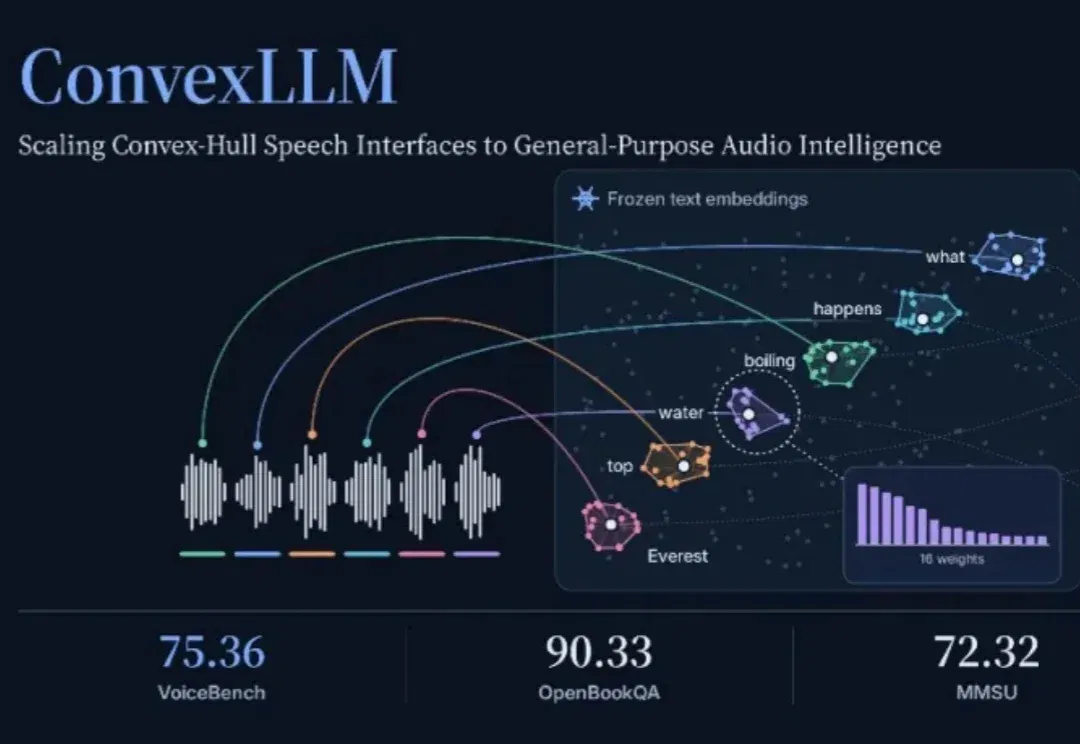
ConvexLLM connects speech to language models through frozen text embeddings (opens in a new tab)
Researchers at CUHK-Shenzhen and Microsoft propose C-Gate, mapping audio into convex combinations of frozen text embeddings. The paper reports VoiceBench gains against its listed open-model baselines, while audio understanding and transcription still involve trade-offs.
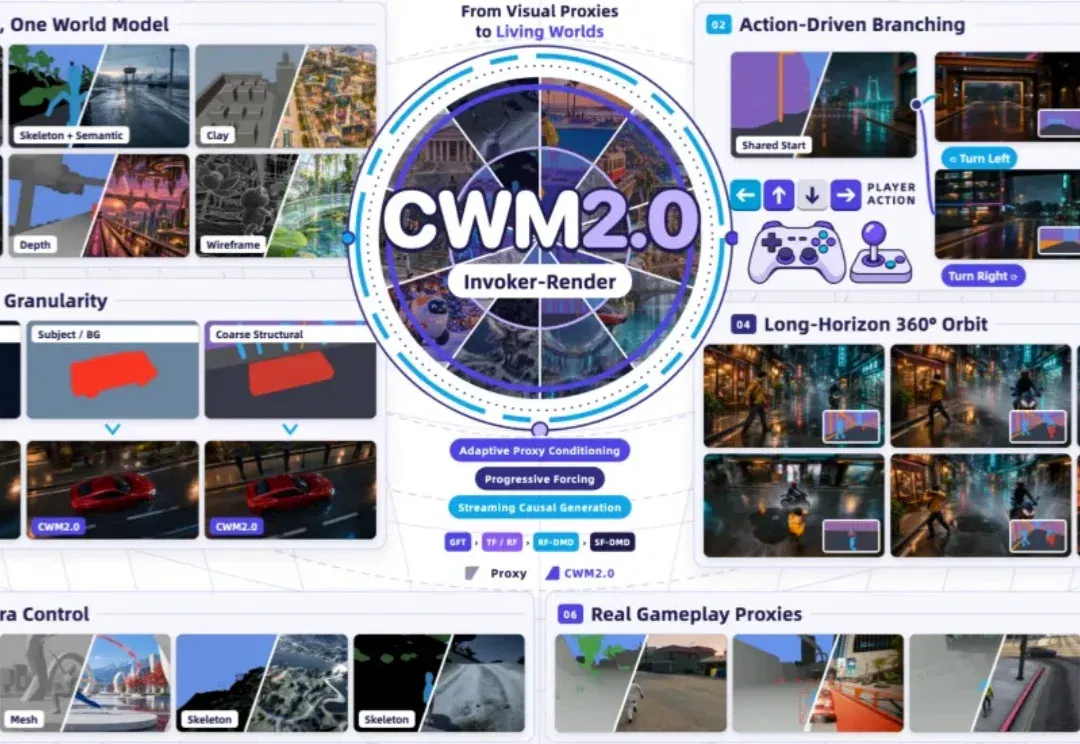
CWM2.0 open-sources generative rendering with a 30-minute racing demo (opens in a new tab)
Teams from Ant, Westlake University and Zhejiang University use a structured Proxy to control scene state and Invoker-Render to generate visuals, releasing eight-GPU streaming inference. The long demo and 140 evaluations cover specified scenes, not arbitrary stable worlds.

Ankole outlines multi-user agent architecture: events, permissions and organizational memory (opens in a new tab)
The team describes its Business Harness design for fast and slow paths, shared state, Actor orchestration and dynamic permissions. Formal verification covers the modeled core permission state machine; it does not replace security checks of the full deployment, external interfaces or implementation.
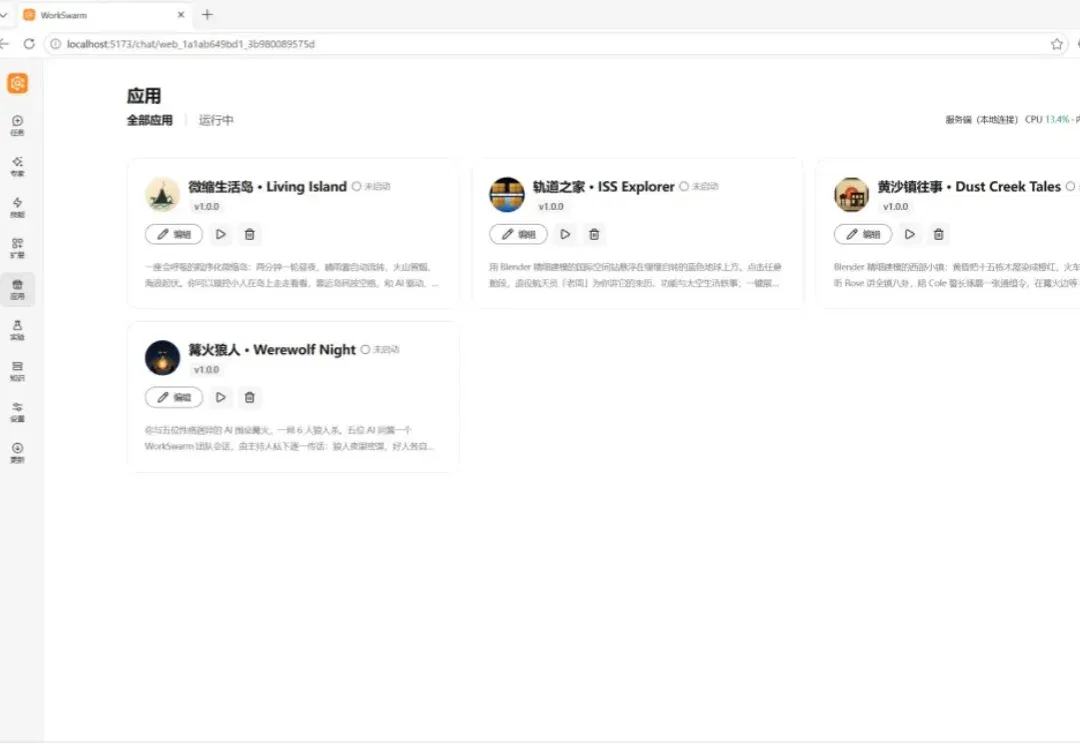
openJiuwen presents a Harnessless approach for reusing AgentOS execution tools (opens in a new tab)
openJiuwen uses app-development and swarm demos to show how built-in harness capabilities support sessions, tools and app management. Applications still define business rules and permissions; remote deployment and some capabilities remain planned or exploratory.
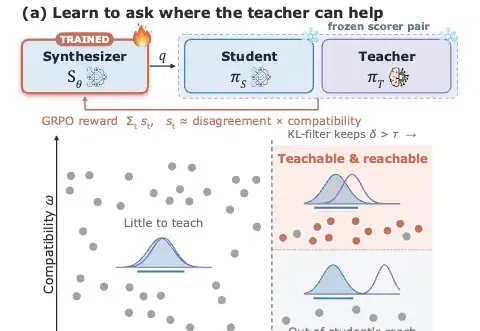
Ask-to-Distill optimizes training questions using teacher–student distribution signals (opens in a new tab)
UIUC and collaborators propose A2D, training a question generator with frozen teacher–student disagreement and compatibility signals before on-policy distillation. The paper reports gains in math, code and agent tasks; its learning-value proxy has limits.